How to Make a Publication-Ready XRD Figure Without Origin
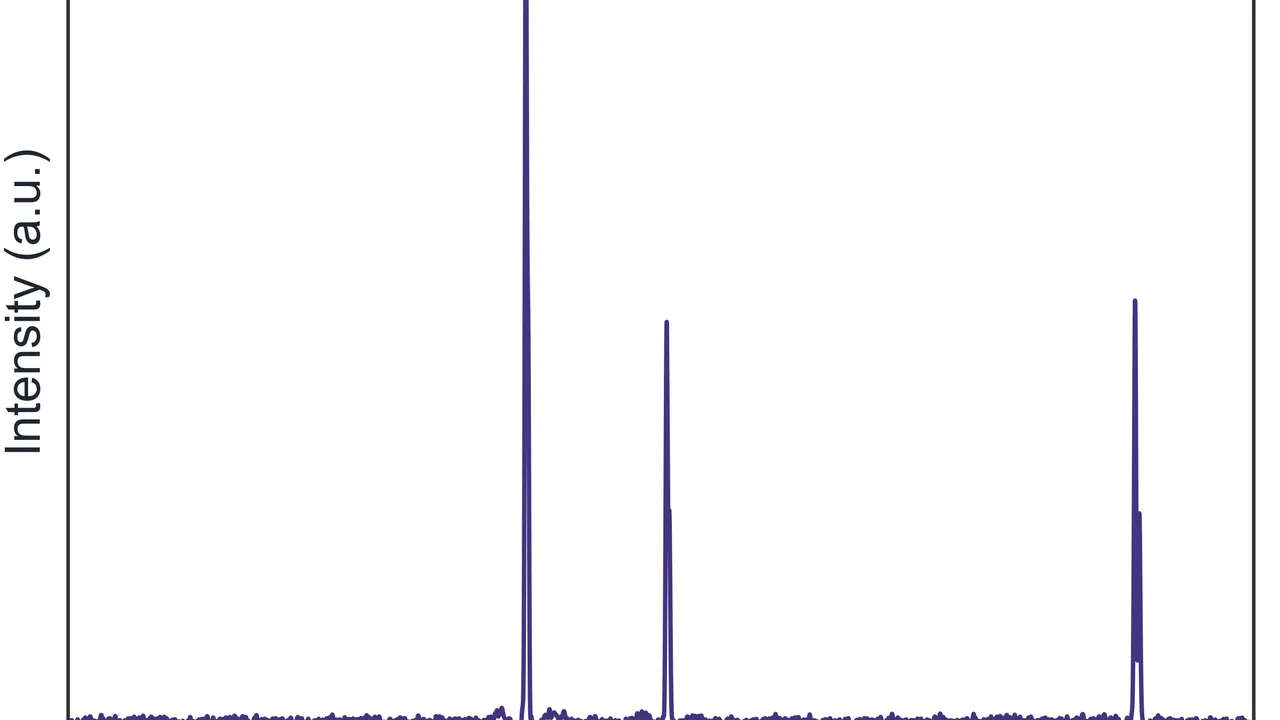
Why does one XRD figure take so long to finish?
The diffractometer can generate a pattern quickly. Turning that raw file into a figure suitable for a paper is another matter. You may need to handle the instrument format, background, noise, sample spacing, colors, legends, fonts, axis ticks, peak labels and export resolution.
Origin is powerful and Python is highly customizable, but neither is always the fastest starting point for a researcher who only needs a clean, repeatable workflow for common XRD and spectroscopy figures. Spectra Studio puts the routine steps into a Windows desktop app, so you can move from instrument data to a journal-style figure without setting up a programming environment.
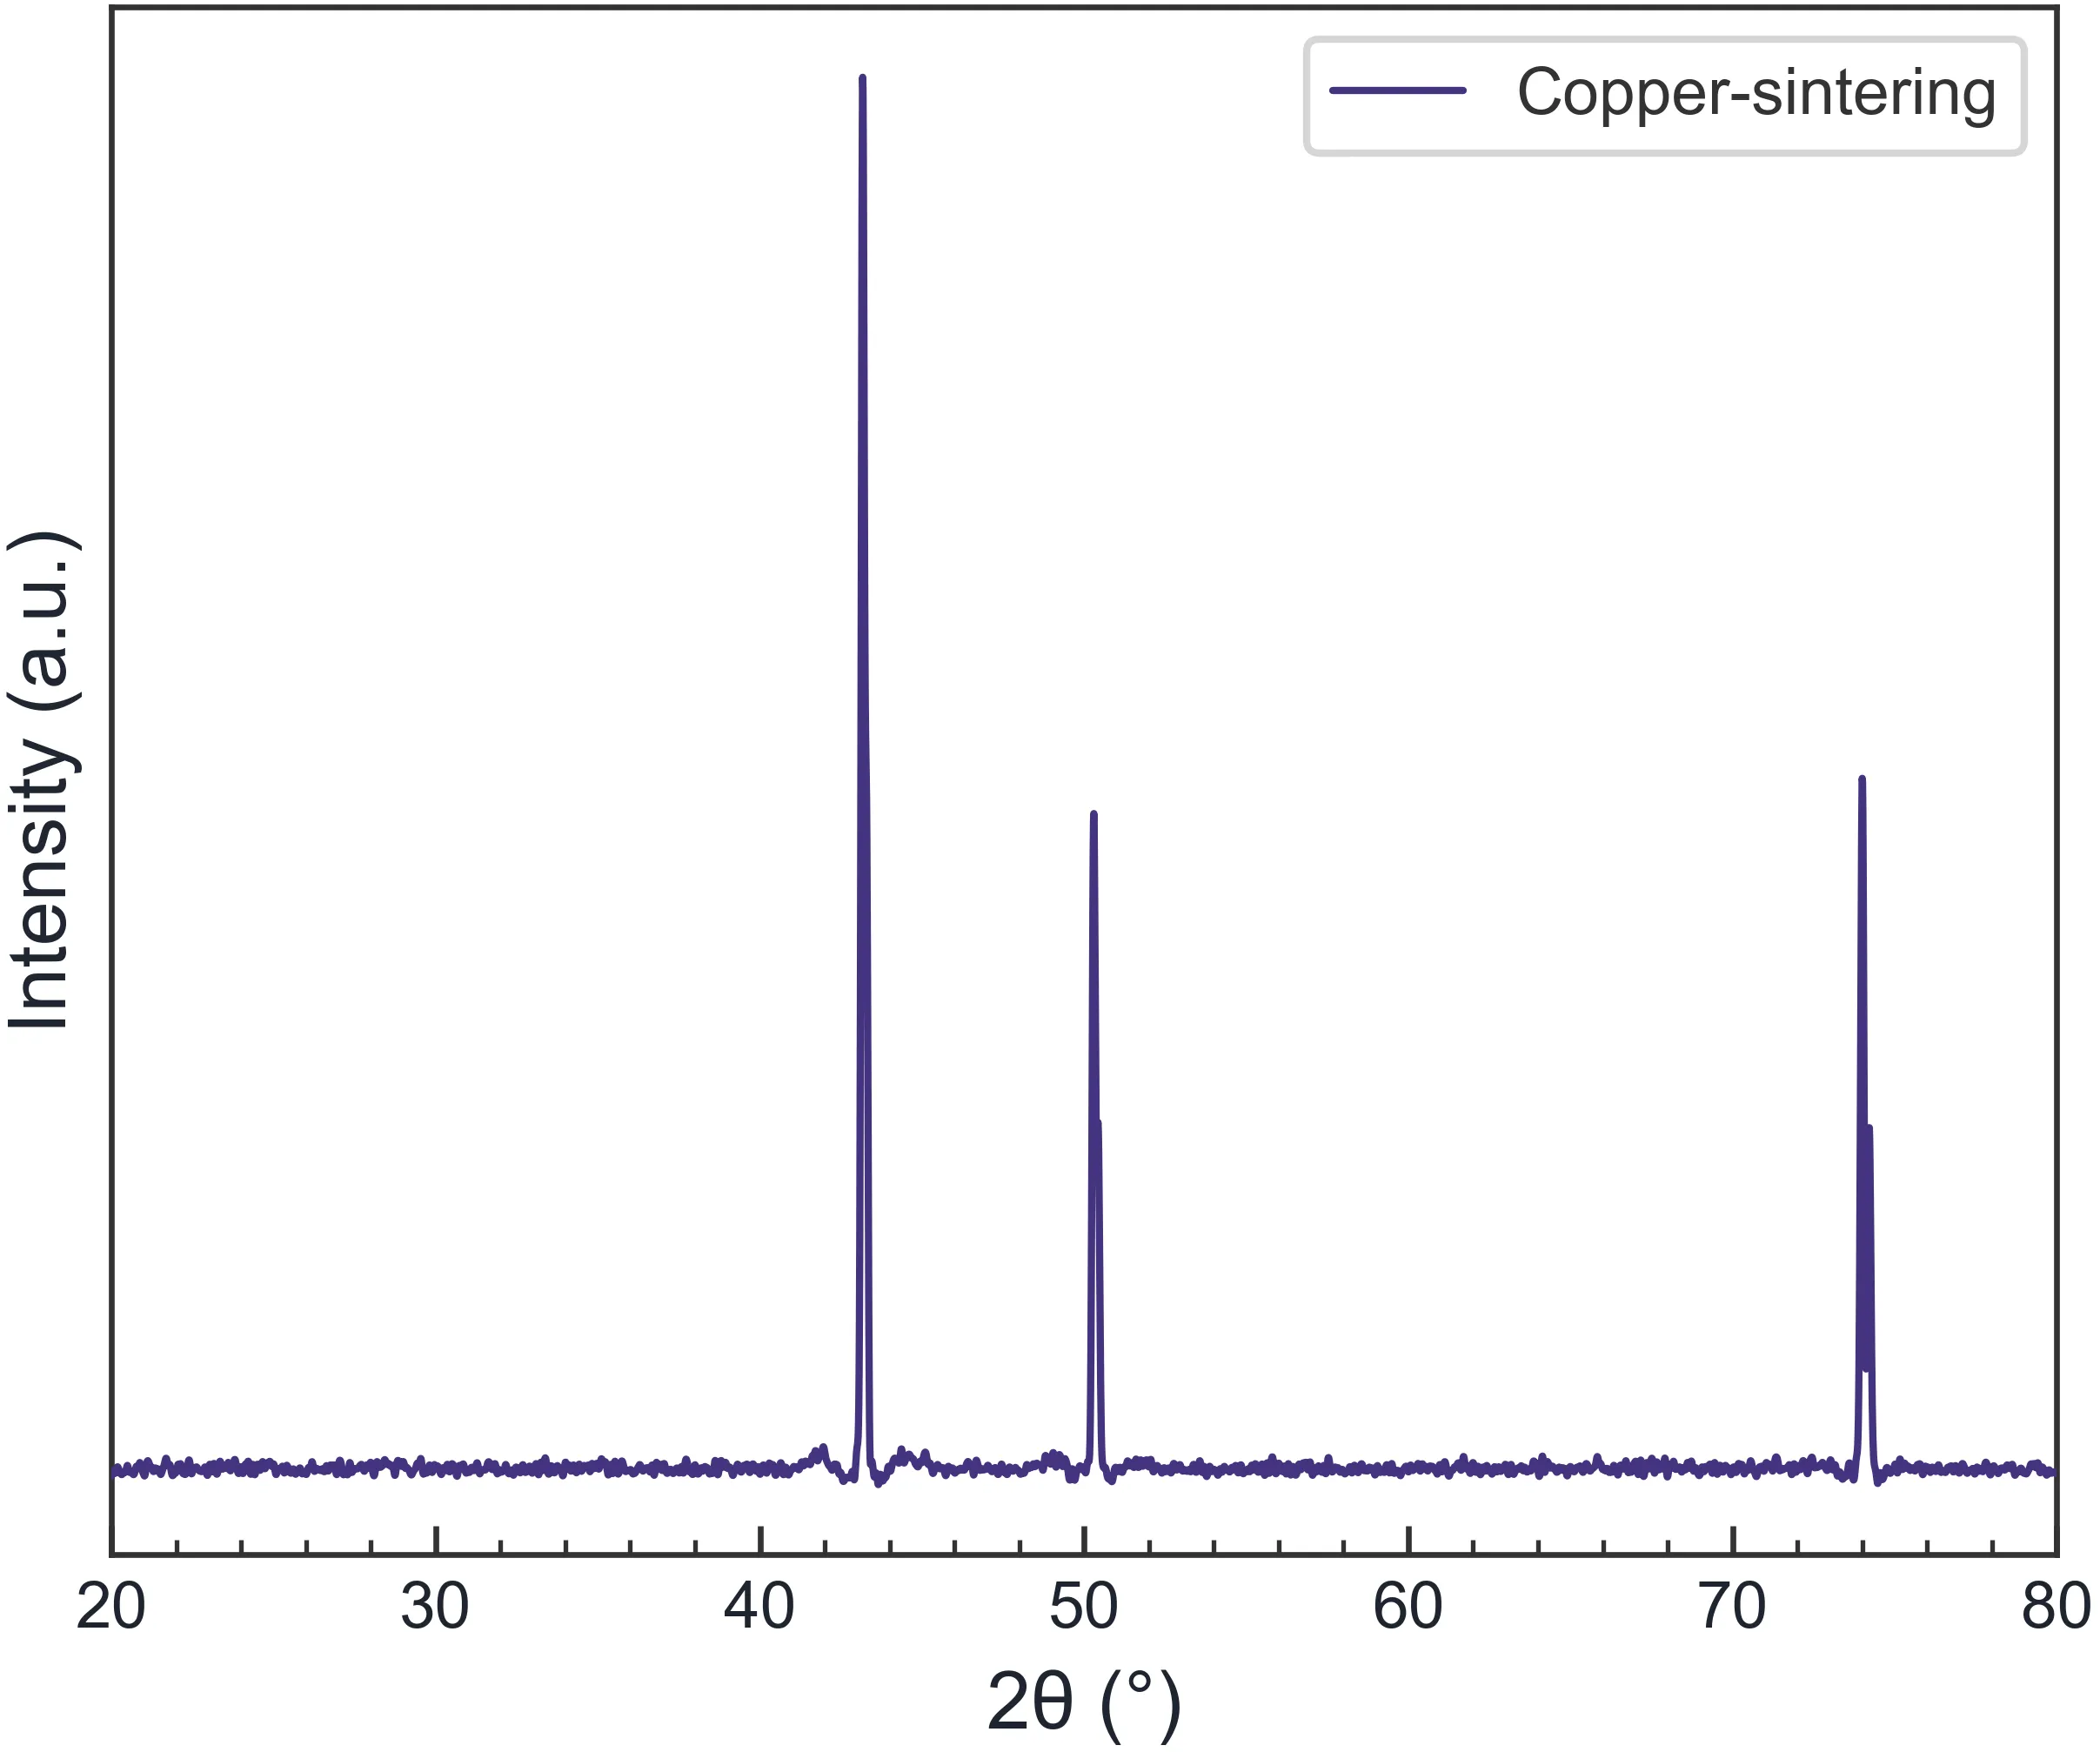
Who needs a simpler XRD plotting workflow?
Spectra Studio is useful when you:
- need to prepare several XRD patterns before a submission;
- work on a lab computer where Python packages are inconvenient to install;
- want overlay, stack, normalization, vertical offsets and batch colors;
- need watermark-free PNG/JPG output for a report or draft;
- want PDF, SVG, EPS or TIFF output for a journal submission;
- prefer to keep unpublished spectra on a local machine.
The Free edition is not a countdown demo. Basic loading, preprocessing, peak detection, journal styles and PNG/JPG export work without a time limit or watermark.
Make an XRD journal figure in about ten minutes
The following workflow uses several XRD samples that need to be compared in one figure.
Step 1: Load several XRD files at once
Click Load data, or drag files into the application. Spectra Studio reads PANalytical .xrdml, Bruker .brml, .uxd and common .txt, .xy, .csv and .dat two-column data.
After loading, the sample list appears on the left and the curves are shown immediately. Use overlay when the main goal is to compare peak positions. Use stack or vertical offset when the curves would otherwise cover one another.
Step 2: Preview smoothing and baseline correction
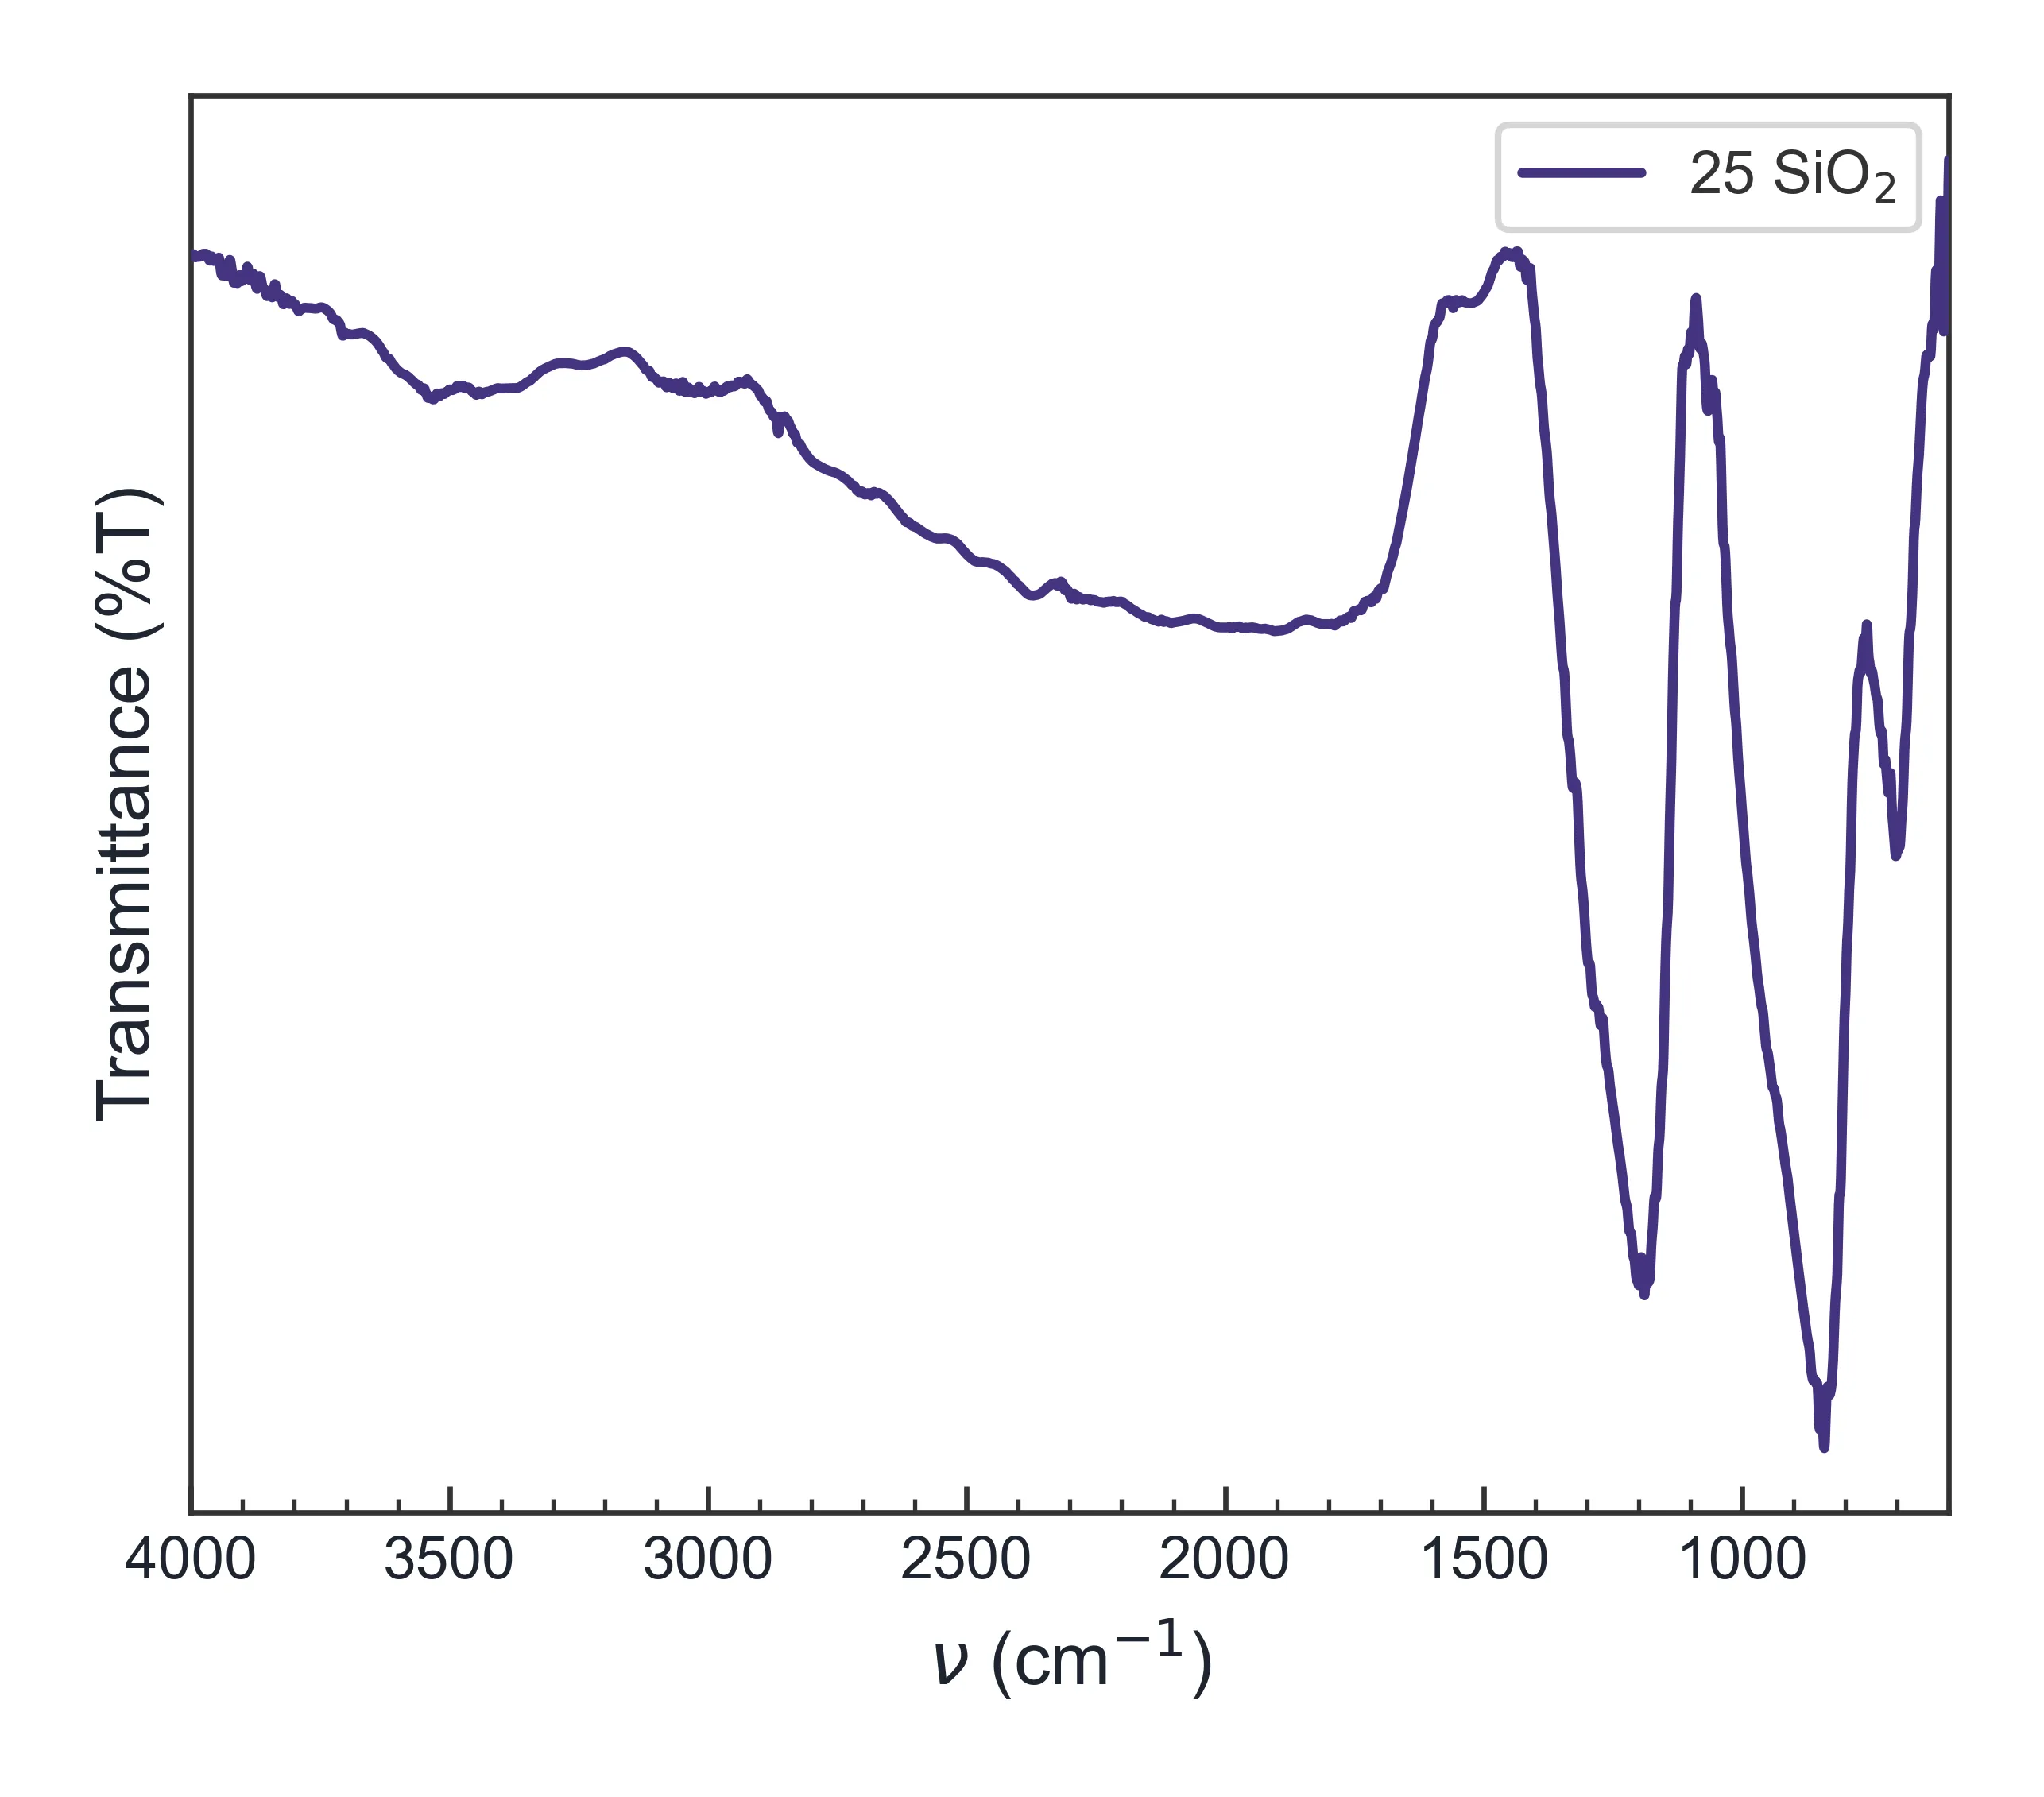
If the pattern is noisy, adjust Savitzky–Golay smoothing in the preprocessing panel. If the background slopes or contains fluorescence, try ALS baseline correction. Changes are previewed live, so you can see whether a weak feature remains visible.
Do not smooth simply to make the plot look more attractive. A paper figure should represent the data faithfully. Keep a raw-data copy, use the lightest treatment that supports interpretation, and record the parameters for the methods section.
Step 3: Detect and review peaks
Select Auto peak detection to find candidate peaks based on height and shape. Adjust the sensitivity for weak signals or a difficult background, then review the annotations on the plot.
Automatic detection is useful for speeding up repetitive work, but it is not a substitute for checking the pattern. A background fluctuation may be marked as a peak, while a weak or overlapping reflection may need manual review.
Step 4: Apply a journal style
Spectra Studio provides three starting styles:
- Nature: borderless, minimal and compact;
- ACS: left and bottom axes, stronger lines and an in-figure legend;
- Elsevier: a full frame with a classic academic layout.
Each style remains adjustable. Tune the font, font size, line width, tick direction, tick length, legend position, title and axis ranges. Treat these as a starting point, then check the target journal’s author guidelines before submission.
Step 5: Export at the right resolution
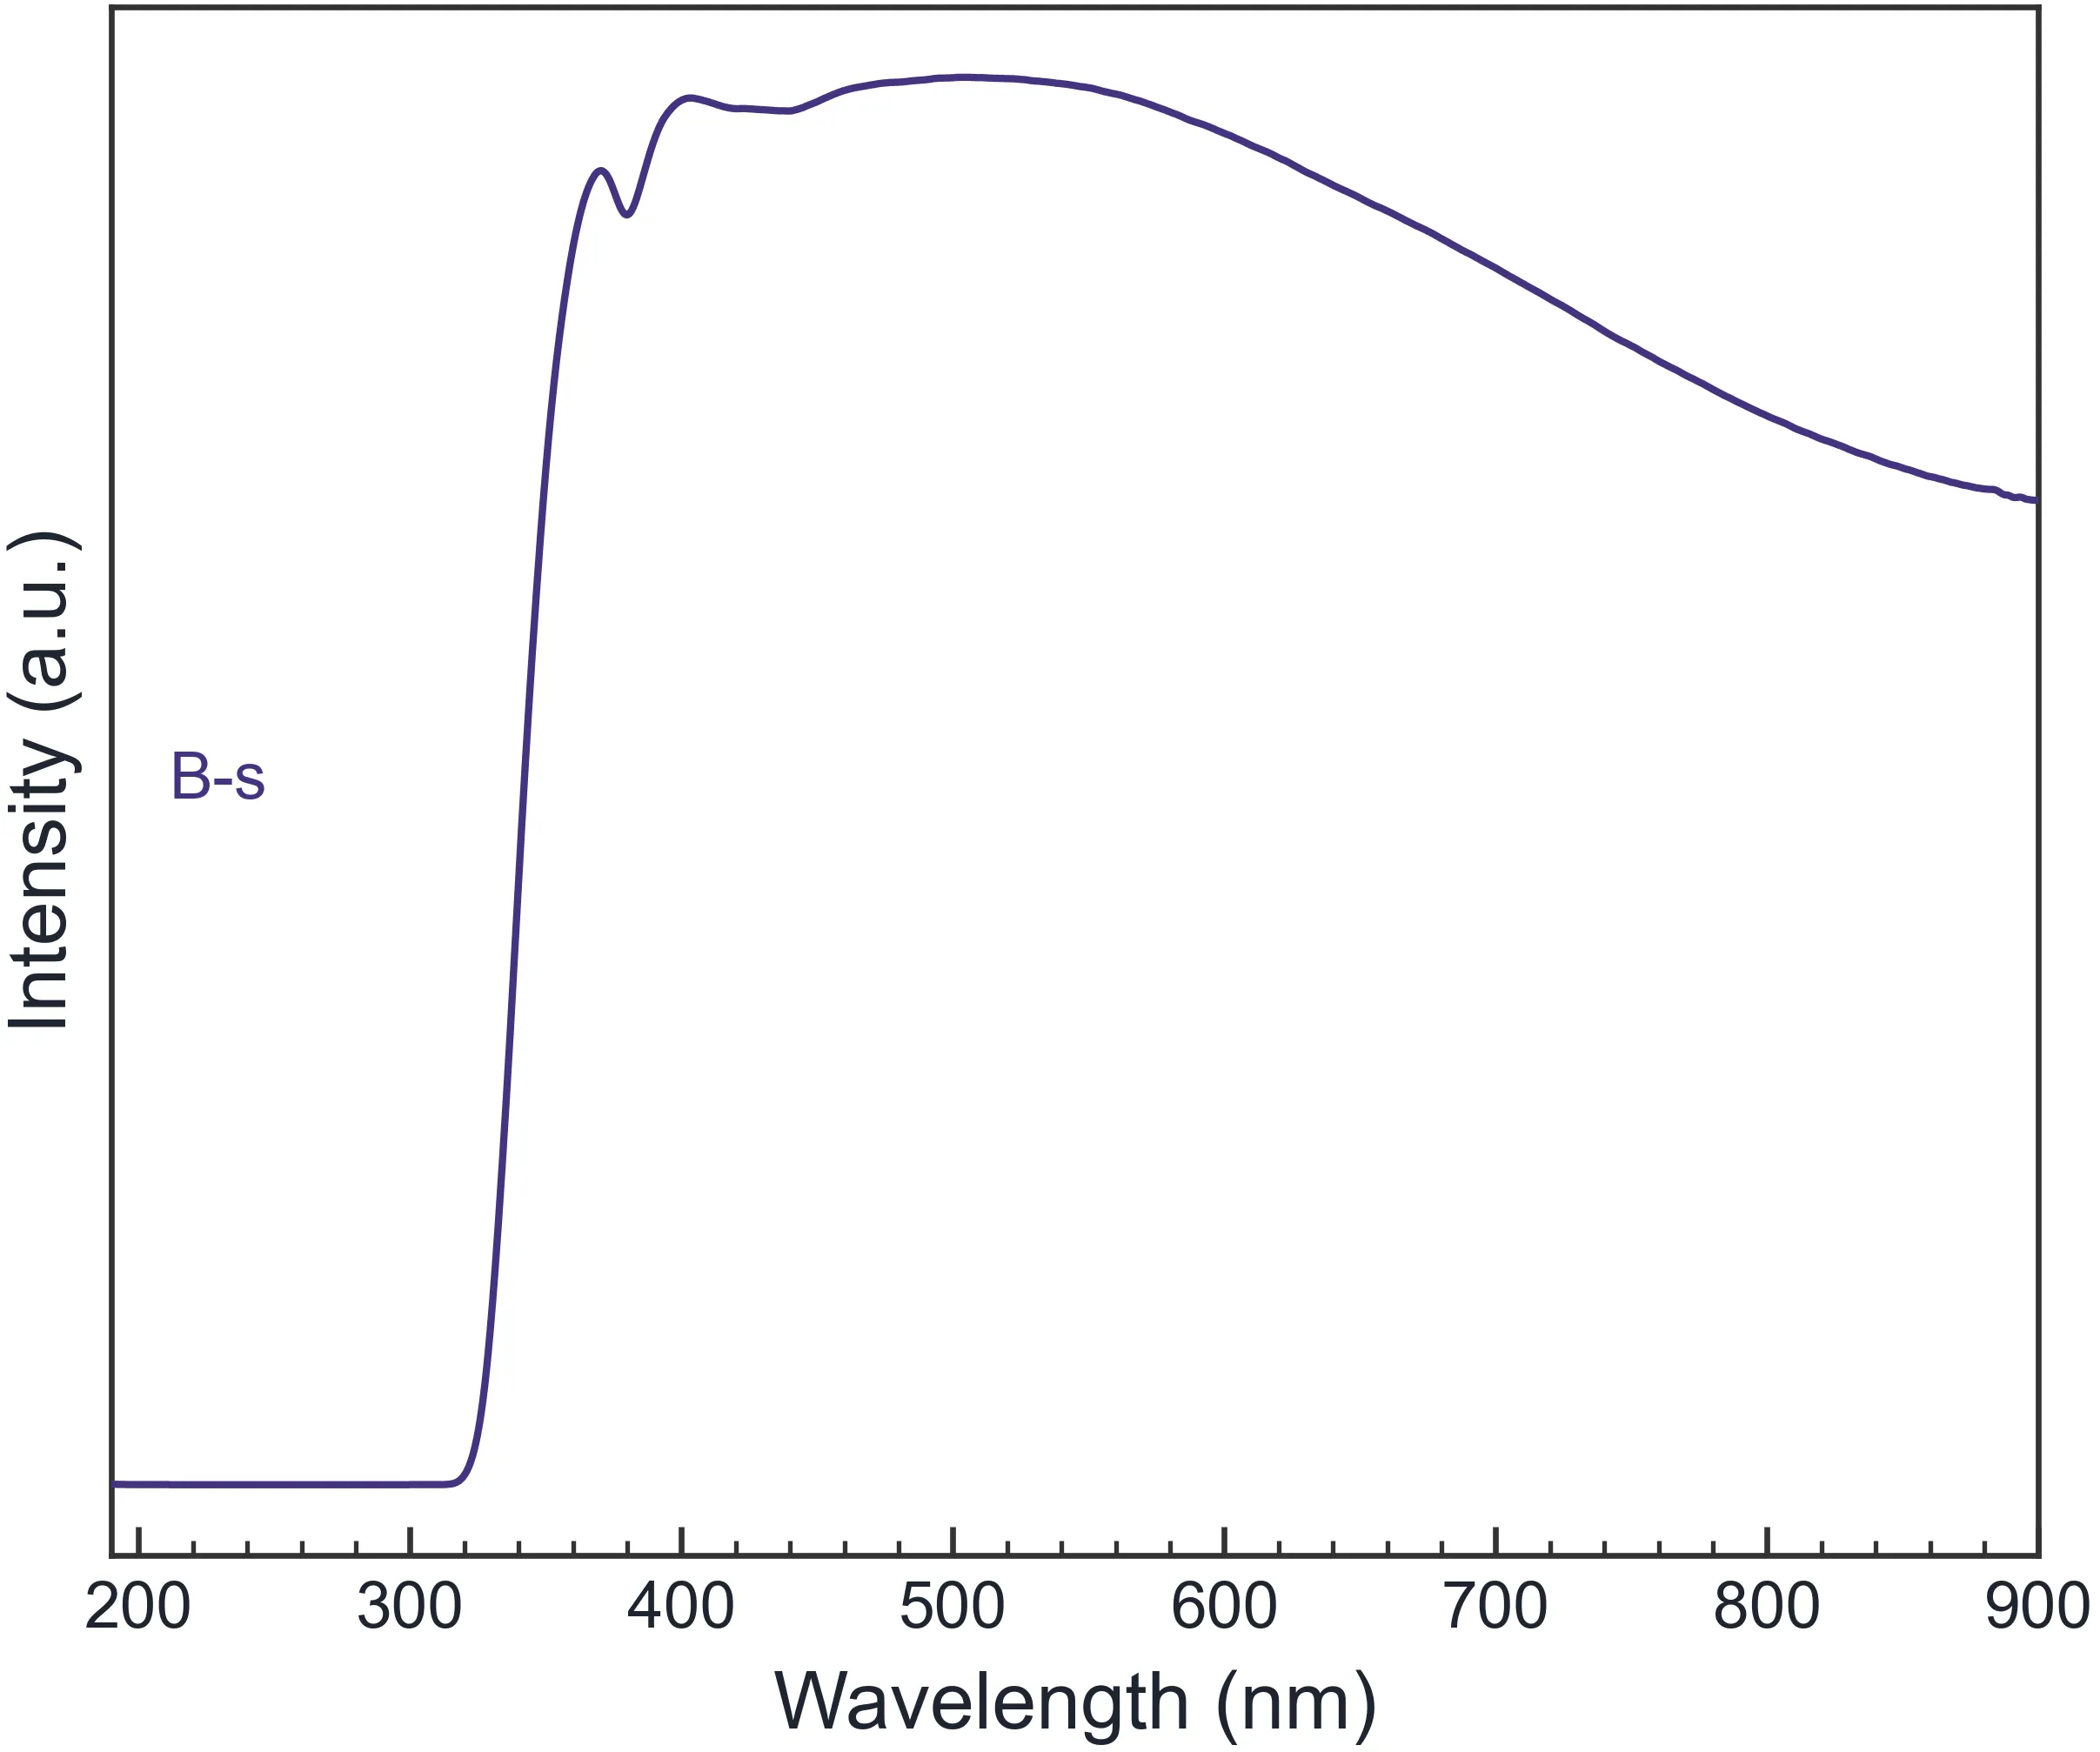
The Free edition exports watermark-free PNG/JPG files up to 300 DPI. Pro adds PDF, SVG, EPS and TIFF output, with resolutions up to 600 DPI.
Vector formats are especially useful when the figure contains fine lines, peak labels or small text. Avoid taking a screenshot and enlarging it inside Word; rasterized text and lines can become blurry or jagged.
Free versus Pro
The Free edition is enough for loading, overlaying, stacking, normalizing, smoothing, baseline correction, peak detection, journal styling and PNG/JPG export.
Pro adds:
- Gaussian, Lorentzian and mixed-profile peak fitting;
- position, FWHM, area, R² and residual diagnostics;
- Scherrer crystallite size;
- Williamson–Hall plot and microstrain;
- crystallinity calculation;
- UV-Vis Tauc bandgap analysis;
- PDF reference-card phase matching and Miller indices;
- PDF/SVG/EPS/TIFF output and higher resolution.
Both editions use the same installer. Pro is a one-time key rather than a monthly subscription, and activating it does not require downloading a second application.
Is it a replacement for Origin or Python?
Not necessarily. Origin and Python remain excellent choices for custom models, advanced statistics and large automated pipelines. Spectra Studio is better understood as a focused tool for the common, repeated laboratory tasks: load the instrument files, clean the curves, compare samples, detect peaks and produce a consistent figure.
You can use it alongside an existing Origin template or Python workflow. It is particularly useful when a student or collaborator needs a quick figure on a Windows instrument computer without first installing a development environment.
Common questions
Is Spectra Studio really free?
The Free edition can be used without a time limit and does not add a watermark. Advanced fitting, quantitative analysis and vector export are Pro features.
Does it require Origin, Python or extra packages?
No. The Windows installer is about 120 MB and includes the application runtime.
Can the Free edition make a paper figure?
Yes. It exports watermark-free PNG/JPG images up to 300 DPI. If a journal requires PDF, SVG, EPS or TIFF, use the Pro export features.
Are spectra uploaded to the cloud?
The analysis runs locally. The Free edition does not require an account, and the spectra are not uploaded for processing.
Does it work on macOS or Linux?
The current release targets Windows 10/11 64-bit. macOS and Linux users would need a compatible Windows environment.
Final takeaway
The purpose of a publication figure is to make material differences and analysis results easy to read—not to consume an entire evening in manual formatting. Spectra Studio combines multi-file loading, preprocessing, peak detection, journal styling and high-resolution export in one Windows workflow, so you can make a first clean XRD figure without starting with Origin or Python.
👉 Download Spectra Studio and start making XRD figures: See the complete Spectra Studio guide
Related Posts
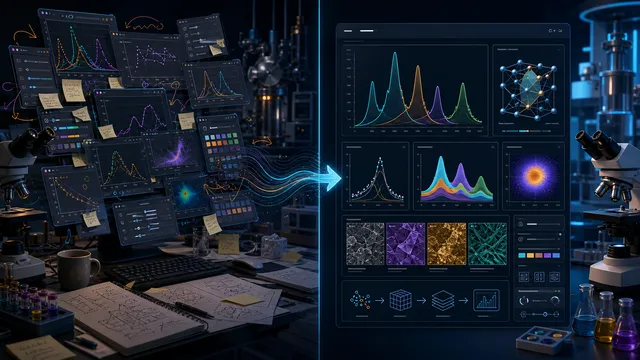
How to Standardize Spectroscopy Figures for a Paper
Build consistent XRD, FTIR, Raman, and UV-Vis figures with repeatable offsets, fonts, axes, and export settings instead of reformatting every plot.
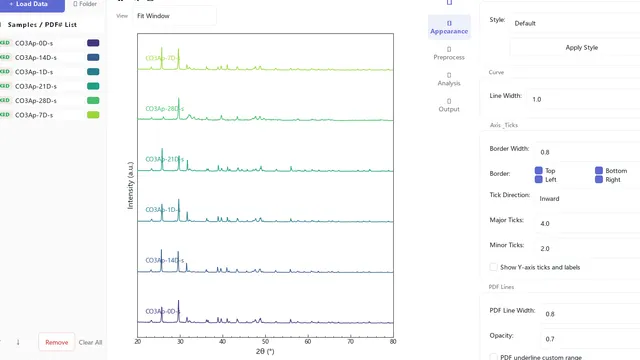
Spectra Studio: Turn XRD, FTIR, Raman & UV-Vis Data Into Publication-Ready Figures — Without Origin or Python
Free Windows app that turns raw XRD, FTIR, RAMAN, UV-Vis and DSC/TGA data into journal-ready figures in minutes — no Origin, no Python, no watermark. Multi-format loading, peak fitting with R² and residuals, Scherrer & Williamson-Hall crystallite size, Tauc bandgap, PDF-card phase matching, Miller indices, and vector export (PDF/SVG/EPS/TIFF). Download free; Pro unlocks instantly with a key.
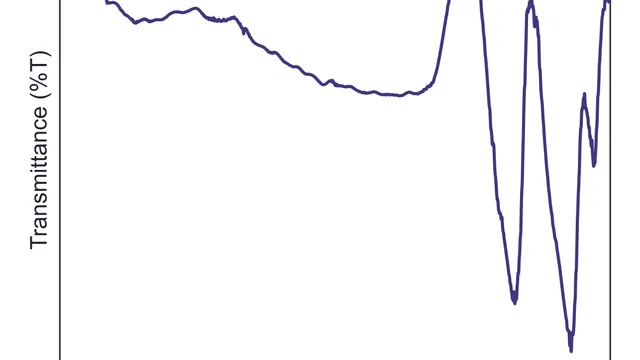
How to Process FTIR and Raman Spectra for a Publication Figure
A practical FTIR and Raman workflow for Windows: load multiple files, correct the baseline, smooth carefully, stack spectra, detect peaks and export a journal-ready figure.