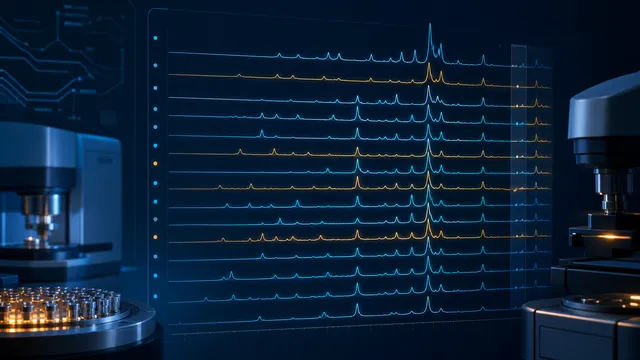
Guides
How to Overlay FTIR, Raman, and XRD Spectra
Choose overlay, stack, offset, normalization, and baseline correction for multi-sample FTIR, Raman, and XRD comparisons without hiding real differences.
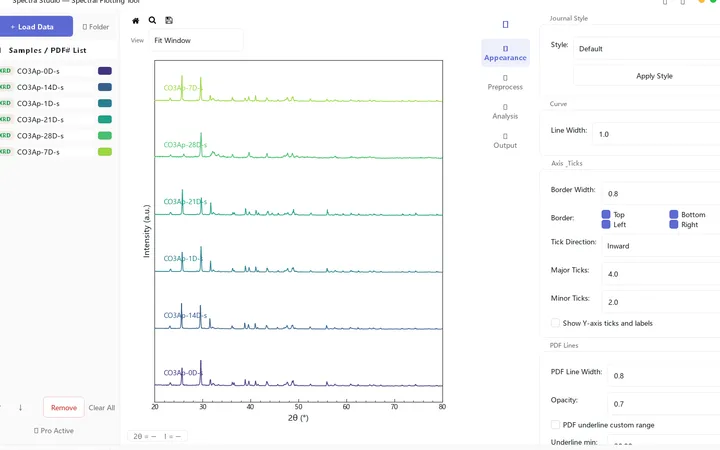
Free spectral plotting and XRD analysis for XRD, FTIR, RAMAN, UV-Vis & DSC — load, clean, fit, and export journal-ready figures in minutes.
Measure particle and pore size distributions from SEM images automatically. Two algorithms (Watershed and Hough Circle), interactive scale calibration, and exportable statistics.
One-click fix for Word thesis formatting: page numbers, figure/table numbering, heading levels, references, and cover. Rules live in YAML, and the GUI takes a drag-and-drop file.
Choose overlay, stack, offset, normalization, and baseline correction for multi-sample FTIR, Raman, and XRD comparisons without hiding real differences.
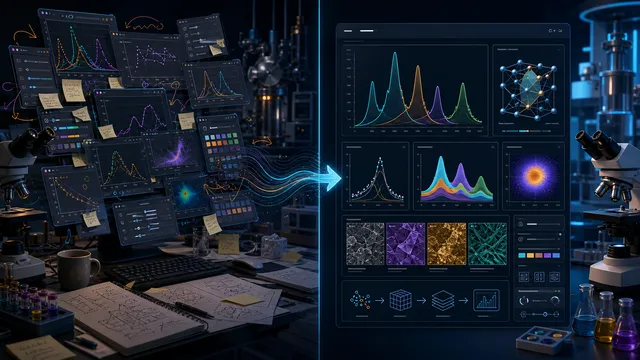
Build consistent XRD, FTIR, Raman, and UV-Vis figures with repeatable offsets, fonts, axes, and export settings instead of reformatting every plot.

Open common XRD, FTIR, Raman, and UV-Vis exports without a conversion maze. Learn what to verify before plotting data locally on Windows.
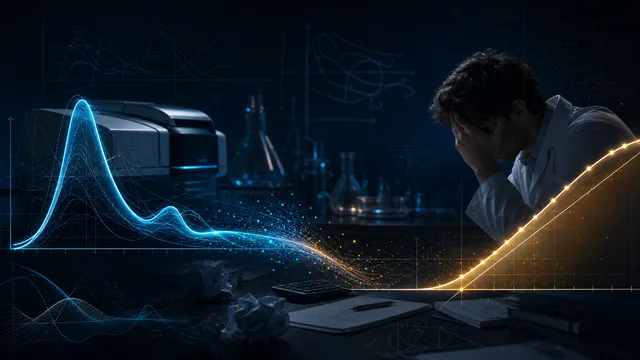
See how transition type, fit-window selection, thickness, scattering, and Urbach tails change a Tauc band-gap estimate—and how to report it clearly.
Learn why overlapping peaks, sloping backgrounds, and instrument broadening can make manual XRD FWHM unreliable, and what to check before fitting.
A practical FTIR and Raman workflow for Windows: load multiple files, correct the baseline, smooth carefully, stack spectra, detect peaks and export a journal-ready figure.